
ORaaS Approach Demo
This demo computes the periods when the distance between two satellites are below a given threshold.
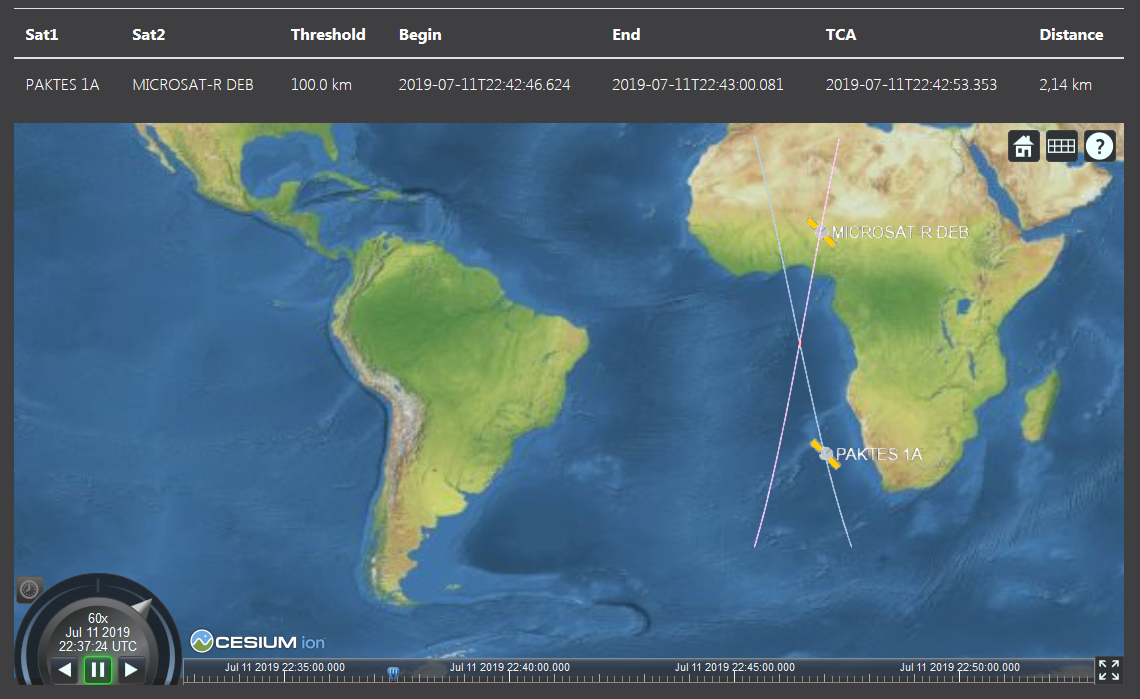
Input two TLE, the critical periods (if any) are displayed in the table. Click the Show in Viewer button, the orbits are displayed in a viewer, the path is highlighted in red.
Note that our Visibilities demo provides you a way to get several orbits displayed in a viewer.
-
Quick start
- For each satellite, paste the Two Lines TLE1 and TLE2 which define the orbit,
- input the period of the simulation and the critical distance in kilometers,
- ... or click the Example button to populate the form.
- Click the Compute Critical Periods button.
A table is displayed with the critical periods (if any) between the two dates. They can be displayed in a Cesium viewer.
A sample result might look like this.
-
TCA
The TCA (Time of Closest Approach) is the time at which the relative distance reaches its minimum value (the dot product of deltaPosition and deltaVelocity is zero).
In the table, a line is displayed for each critical period with its limits and the TCA with the minimum distance.
Please note that no TCA may be defined if the critical period is not entirely included in the simulation period.
-
-
-
ORaaS services
Our approach demo illustrates the service published by ORaaS, which offers several ways to define your satellites orbit. Details can be found in our API documentation.